
Ethereum is slowly moving lower below $1,300 against the US Dollar. ETH remains at a risk of major decline if it stays below $1,400 for a long time.
Ethereum started a fresh decline after it failed to clear the $1,350 resistance.
The price is now trading below $1,320 and the 100 hourly simple moving average.
There was a break below a key bullish trend line with support near $1,320 on the hourly chart of ETH/USD (data feed via Kraken).
The pair could gain bearish momentum if it breaks the $1,265 support zone.
Ethereum Price Grinds Lower
Ethereum attempted a fresh increase above the $1,350 level, similar to bitcoin price. ETH struggled to gain pace for a move above the $1,350 level.
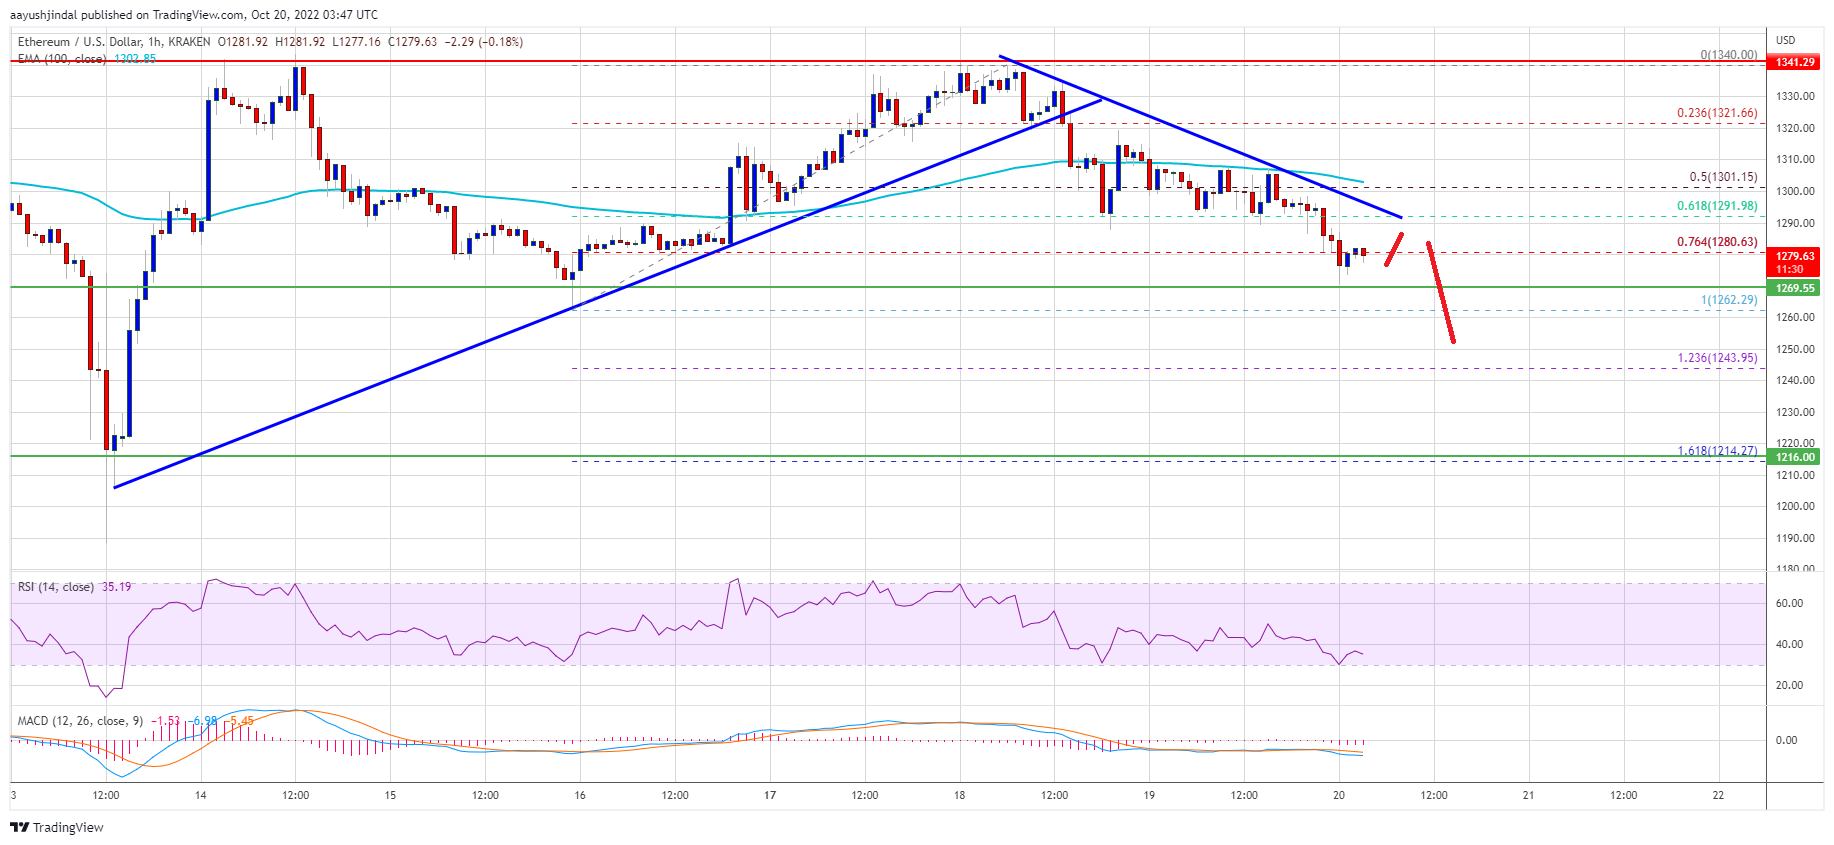
The price traded as high as $1,340 and started a fresh decline. There was a move below the $1,320 support zone. Besides, there was a break below a key bullish trend line with support near $1,320 on the hourly chart of ETH/USD. The pair even declined below the 50% Fib retracement level of the upward move from the $1,262 swing low to $1,340 high.
Ether price is now trading below $1,320 and the 100 hourly simple moving average. An immediate resistance on the upside is near the $1,290 level and a connecting bearish trend line on the same chart.
Source: ETHUSD on TradingView.com
The first major resistance is near the $1,300 level and the 100 hourly simple moving average. A clear upside break above the $1,300 resistance zone could open the doors for a move towards the $1,320 level. The main resistance is still near the $1,350 level, above which ether price might accelerate higher.
Downside Break in ETH?
If ethereum fails to climb above the $1,300 resistance, it could continue to move down. An initial support on the downside is near the $1,265 level.
The next major support is near the $1,240 level or the 1.236 Fib extension level of the upward move from the $1,262 swing low to $1,340 high. A downside break below the $1,240 zone might start a fresh decline to $1,220. Any more losses may perhaps open the gates for a move towards the $1,200 support.
Technical Indicators
Hourly MACD – The MACD for ETH/USD is now gaining momentum in the bearish zone.
Hourly RSI – The RSI for ETH/USD is now below the 50 level.
Major Support Level – $1,265
Major Resistance Level – $1,300